COVID19 IN CHINA
The new infections and the relative forecast of the
COVID19 in China are examined presenting the new ones and the total ones in the following figure, in linear scale. The asymptotic value is around 80,000 cases.

The forecast of the new infections is done by using the Malthus exponential curve and the Verhulst curve (also called S-shaped or logistic curve).
The forecast of the new infections is done by using the Malthus exponential curve and the Verhulst curve (also called S-shaped or logistic curve).
The forecast are made beginning from certain days that
appeared as important or crucial, as, February 1st, 6th,
11th and 15th, as shown from the figure in logarithmic
scale, which evidences the smaller values.
The Malthus exponential curve requires the definition
of the rate of increase, named r in certain equations, while the Verhulst curve
requires, besides the constant r, also the constant K, as is named in certain
equations.
The exam of the figure, in linear scale, indicates
that a correct forecast up to the total number of 81,400 infections is possible and almost feasible when the collected data
are significant and enough large.
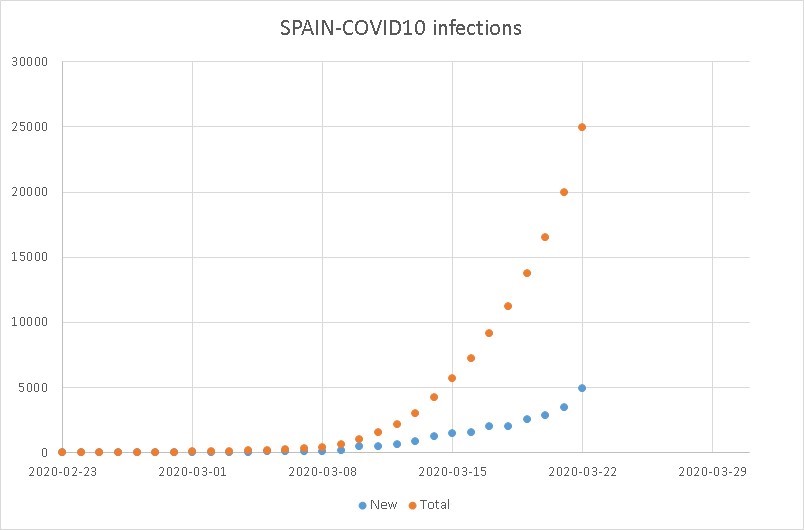
During the next days I will examine the forecast of
the new cases in the other countries involved in the COVID19 pandemia.
Fabio Gori
gori@uniroma2.it
gori@uniroma2.it


Commenti
Posta un commento