Post

SPAIN COVID19 FORECAST MARCH 24TH 2020

Immagine
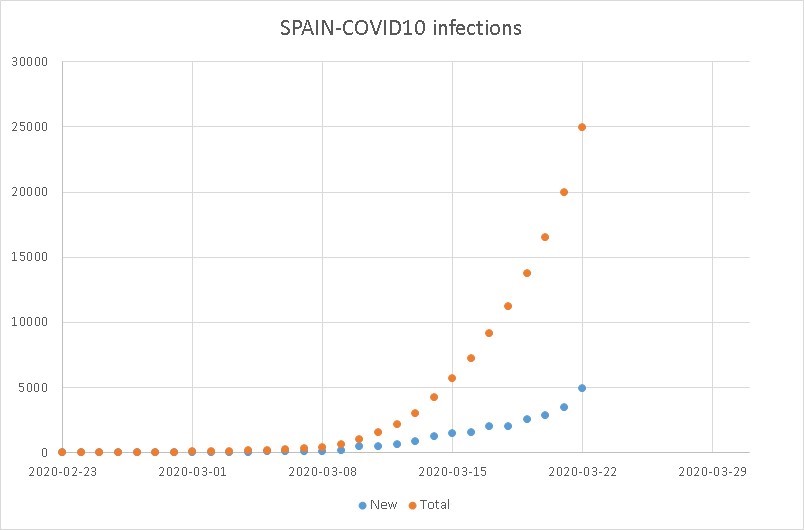
March 24th, 2020. I have examined the situation of the infections in Spain, as it appears from the data up to March 23rd. The first two figures show the new and total cases of COVID19 in linear and logaritmic scales. The linear figure shows a trend which appears to be exponential. Fabio Gori, University of Rome Tor Vergata, Rome, Italy.   https://didattica.uniroma2.it/docenti/curriculum/4295-Fabio-Gori www.termofluidodinamica.it   https://covid19forecast.blogspot.com/ https://eucovid19.blogspot.com/ https://usacovid19.blogspot.com/  https://forbigaio.blogspot.com/   The logaritmic curve shows a slight deviation from the linear trend.   The forecast of the new infection, starting from the 22nd, shows that an asymptotic value of around 42,000 is going to be reached by the end of this month.  The following figure presents the same data in logaritmic scale.

ITALY COVID19 OF MARCH 24TH

Immagine
March 24th, 2020. I have examined the situation of the infections in Italy, as it appears from the data up to March 23rd. The first two figures show the new and total cases of COVID19 in linear and logaritmic scales. The linear figure shows a trend which appears close to exponential, while the logartmic one allows the hope to a slight inflection of the logartmic linear trend. The next two figures present, besides the new cases, the total ones, the deaths and the dimissions, the forecast made with the Malthus and Verhulst equations, in linear and logaritmic scales. According to the Verhults equation the forecast is to reach a number of  around 62,000 infections by the end of March, in substantial agreement to the forecast of two days ago. Forbigaio

ITALY COVID19

Immagine
March 23rd 2020. I have examined the situation of the infections in Italy, as it appears from the data up to March 21st. The first two figures show the new and total cases of COVID19 in linear and logaritmic scales. The linear figure shows a trend which appears close to exponential, while the logartmic one leaves the hope to a slight inflection of the logartmic linear trend. The next two figures present, besides the new cases, the total ones, the deaths and the dimissions, the forecast made with the Malthus and Verhulst equations, in linear and logaritmic scales. According to the Verhults equation the forecast is to reach a number of  around 60,000 infections by the end of March. Forbigaio

COVID19 IN SOUTH KOREA

Immagine
Today I have investigated the forecast of the COVID19 in South Korea. I have used the same procedure followed with the COVID19 in China posted yesterday.  First of all let's have a look to the new and total cases happened in South Korea until March 20th, presented in the following figure, in logaritmic scale, where the total cases until March 20th is around 860. Then let see the forecast obtained with the Malthus and Verhulst approach applied from the day reported in each of the following figures, in logaritmic and linear scale. The conclusions are similar to the China forecast. A sufficient number of data is necessary before to be able to forecast the total number of cases. Forbigaio

COVID19 IN CHINA

Immagine
The new infections and the relative forecast of the COVID19 in China are examined  presenting the new ones and the total ones in the following figure, in linear scale. The asymptotic value is around 80,000 cases. T he forecast of the new infections is done by using the Malthus exponential curve and the Verhulst curve (also called S-shaped or logistic curve). The forecast are made beginning from certain days that appeared as important or crucial, as, February 1 st , 6 th , 11 th and 15 th , as shown from the figure in logarithmic scale, which evidences the smaller values. The Malthus exponential curve requires the definition of the rate of increase, named r in certain equations, while the Verhulst curve requires, besides the constant r, also the constant K, as is named in certain equations. The exam of the figure, in linear scale, indicates that a correct forecast up to the total number of 81, 4 00 infections is possible and almost feasible when the collected dat

Welcome letter

Welcome letter of March 21st, 2020, first day of the Spring 2020. Dear Friend, today is the first day of the Spring 2020. In this dramatic period I have decided to spend some of my time, as a researcher, to share results of some scientific researches, devoted to forecast (or to try to forecast) what is going to happen in the near future. My thoughts are going to the people who work in these days to help the other human beings in great difficulty because of the COVID19 pandemia. I hope to have your attention and interest Forbigaio